
Kanban Scheduling
What It Is & How It Works
What It Is Kanban?
Kanban scheduling systems are among the most simple, effective and inexpensive means for manufacturing production and inventory control. The concept is proven. From Nagoya to Wichita Falls; from Windsor to Geelong; from micro-electronics to heavy steel they reduce inventory, eliminate stockouts, displace massive computers and slash overhead. They improve both service and quality.
So why doesn't every manufacturer employ this miracle? In many situations, it is inappropriate; other methods work better. Even When Kanban is an excellent choice, firms may ignore it. Kanban scheduling often evokes strong emotional responses and sets a variety of organizational phenomena at work against it.
Kanban production control is simple yet subtle; empowering and also threatening; robust yet delicate; both adaptable and rigid; easy to explain but difficult to understand. It is a key component of most Lean Manufacturing strategies.
These pages describe kanban systems and explain where to use them. They show how to design systems, how to choose the number of cards, and describe real-life examples.
Simple Kanban with Visual Signal
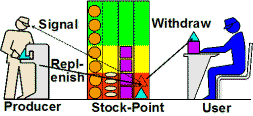
Kanban scheduling systems operate like supermarkets. A small stock of every item sits in a dedicated location with a fixed space allocation. Customers come to the store and visually select items. An electronic signal goes to the supermarket's regional warehouse detailing which items have sold. The warehouse prepares a (usually) daily replenishment of the exact items sold.
In modern supermarkets Kanban signals come from checkout scanners. They travel electronically (usually once a day) to the warehouse. Smaller stores still use visual systems. Here, a clerk walks the aisles daily. From empty spaces he deduces what sold and orders replacements.
Another variation is the bread truck. Here drivers follow a fixed route from store to store. They have a supply of bakery items in their truck. At each stop, they examine the stock and replenish what has been sold. Kanban scheduling in manufacturing works in the same way. The essential elements of a system are:
The entire buy-replenishment cycle is 1-3 days. Supermarkets have very high inventory turns. One legend says that the supermarket was the original inspiration for Kanban.
Kanban In Manufacturing
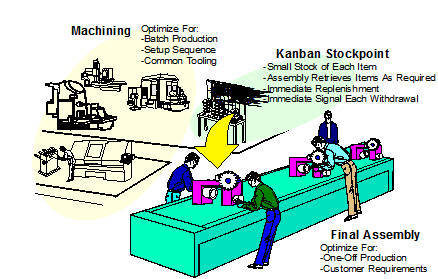
Here, the supermarket principle is applied to a machining and assembly operation. Machining and assembly have very different requirements and considerations for scheduling. Kanban compensates for these differing requirements.
"10 Steps to Effective Kanban"
Quarterman Lee Received Honorable Mention for Bast Paper
■ ■ ■ ■ ■ ■ ■
|
The Strategos Guide To Value Stream and Process Mapping goes beyond symbols and arrows. In over 163 pages it tells the reader how to do it and what to do with it. |
The free newsletter of Lean strategy