
Production Flow Analysis
Coping With Complexity
Production Flow Analysis (PFA) uses a matrix of part numbers and machine numbers to group families. In the matrices below, columns represent the machines whose numbers and names are at the top. Rows represent parts whose numbers and names are on the left. When a particular part requires a particular machine, the operation sequence number is in the intersecting spreadsheet cell. Sometimes, merely an "X" signifies that a particular part needs a particular machine.
Most part families have a "natural sequence." For example "Lathe" normally precedes "Deburr". This natural sequence dominates and becomes the basis for the workcell layout. You can usually ignore sequence issues when developing the PFA matrix.
It is difficult to see order or similarity in the first matrix. Rearranging the rows and columns, as in the second matrix, clearly shows families of similar parts and the machines required to build them. These machines form a workcell.
This example illustrates the principle but it oversimplifies. In practice, these matrices can become quite large. A matrix with more than a few hundred parts and 20 or so machines becomes unwieldy for manual manipulation. However, it can be done. Click for an example with 235 products and 35 processes.
Facilities & Workplace Design has an excellent chapter on workcells with examples of Production Flow Analysis.
Computer programs are available for manipulating large matrices but they cannot solve the problem of inconsistent routings that is often encountered in a PFA analysis. Inconsistent routing means that similar parts use different machines. This occurs for a variety of reasons such as:
-
Parts have usually entered the product mix over a period of many years. Different conditions and different planners over this time have arrived at different routing decisions.
-
Capacity issues may influence routing decisions. For example, machine A would normally be used for a particular operation but it is heavily loaded so the process planner uses machine B.
-
Different process planners have different backgrounds and a different bias. This may lead to different routings for the same part.
Analysts encounter inconsistent routings in most PFA analyses. If the product mix is not too complex, they can make intuitive manual adjustments. When the product mix becomes larger than 100 or so items, PFA becomes too cumbersome and a Coding & Classification analysis is indicated.
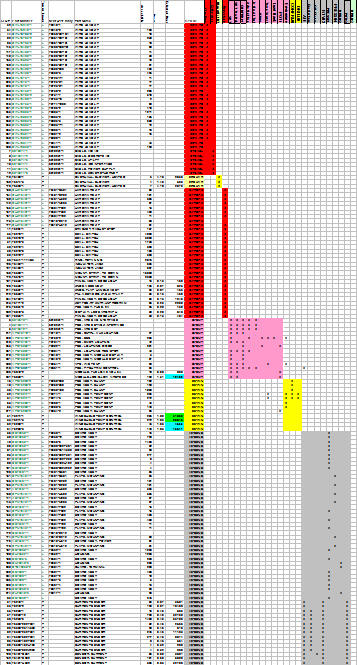
Electronics Manufacturing Example
Below is an actual PFA matrix from an electronics manufacturer. The matrix shows about 50% of the actual parts and families.

■ ■ ■ ■ ■ ■ ■

|
The Strategos Guide To Value Stream and Process Mapping goes beyond symbols and arrows. In over 163 pages it tells the reader how to do it and what to do with it. |
The free newsletter of Lean strategy